“BREAKTHROUGH” TRADING STRATEGIES
Many traders trade breakouts. These are clear and popular setups. Moreover, everyone wants to find an indicator of strong levels. When the price breaks beyond a previously insurmountable level, serving as a reliable barrier, it suggests that some imbalance has arisen in the market, and that strength and energy have emerged that could overcome the barrier. At the same time, there is a possibility that prices will continue to move in the direction of the breakout. A breakout of support and resistance levels is a strong signal of the possible emergence or continuation of a trend. A breakout can be bullish when the resistance level is broken.
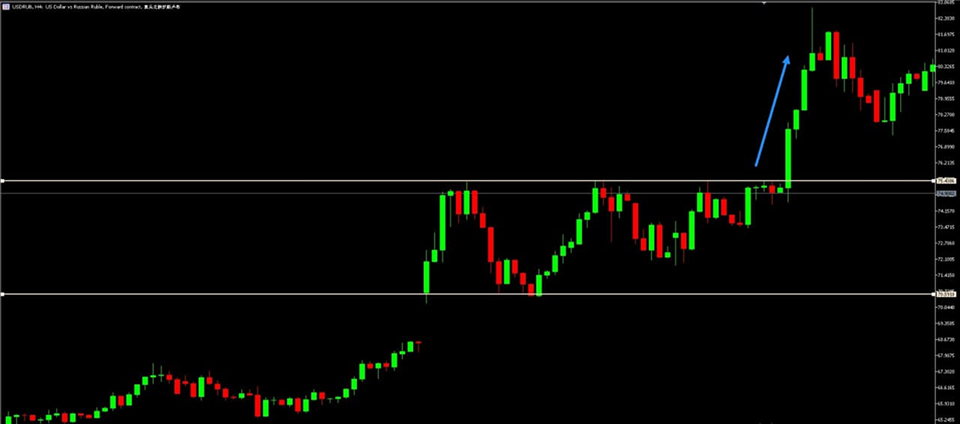
Bullish pattern on the USDRUB chart
Or bearish when the support level is broken.
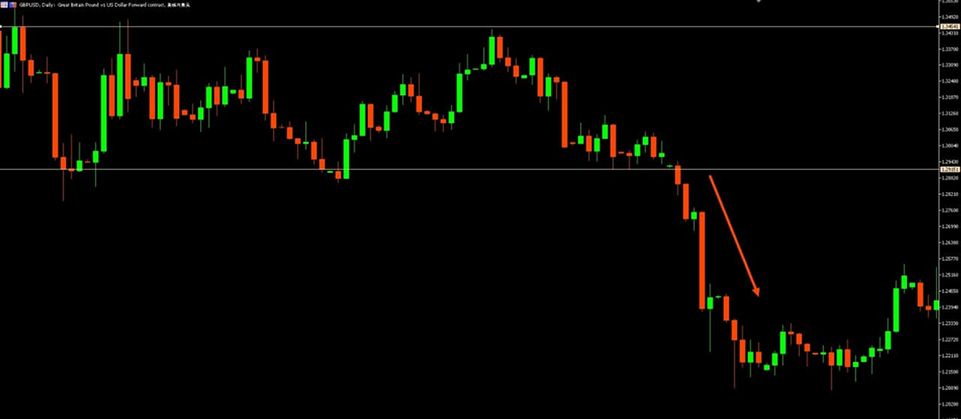
Bearish pattern, GBPUSD
How to trade a level breakout?
To answer the question "how to trade a level breakout?", it's necessary to define what a level is. Most often, traders use: horizontal levels – support and resistance lines, historical and psychological levels; inclined levels – trend lines; channel boundaries, which can be horizontal, inclined, or floating. Each trader sees the market differently. Horizontal levels are the most understandable and predictable. They are minimally dependent on subjectivity and are fully formalized. In stock trading, the accuracy of determining the key level is very important and is measured down to the cent. Forex traders also use trend lines and channel boundaries. Hundreds of variations exist on this topic. If you look at history, you'll see that most strategies are based on breakouts. The “turtle strategy” is based on breaking through the 55-day and 20-day extremes. Bollinger bands are intended both for trading inside the channel and when crossing borders. “Alligator” and B. Williams fractal form a signal when moving averages of different periods are broken and local extremes are overcome. Going back even further, we can recall Jesse Livermore, who, while studying the tape, would pay attention to the moment when the price broke beyond a certain range, and this became a signal. The form varies, but ultimately, the essence of what is happening boils down to the same logic. Any strong level reflects a confrontation between opposing forces—buyers and sellers. If there are two points with the same price on a resistance or support line, then there is reason to take a closer look—there may be a cluster of limit orders and a large buyer or seller present. The third point confirms that the assumption is justified; there may be limit orders here. For a trader, this is a signal. Or, when approaching a strong level, the price "tucks" under the line itself and moves in a narrow range—position accumulation is underway. There is a possibility of a breakout. Price behavior near support or resistance provides insight into whose interests prevail in the market and suggests further developments. A breakout and close of a bar beyond the level suggests that the market may continue moving in the direction of the breakout. This is a chance to catch the beginning of a trend move and open a trade with minimal and understandable risk.
There are many options, but the meaning is the same.
The strongest and most significant levels are identified on the charts of older timeframes - most often on daily ones.
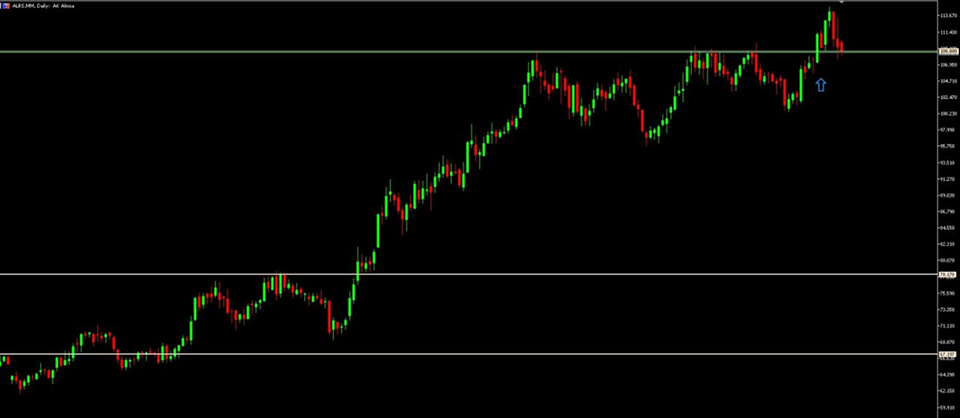
ALRS, D
Alros shares are trading at a strong level at 108.80 rubles, a historic high. As we approach this price area next, it's worth keeping a close eye on the chart. If this level fails to hold, it will pave the way for new highs. Determining the optimal moment to open a trade occurs on smaller time intervals - most often 5-minute ones, but sometimes minute charts are also used.
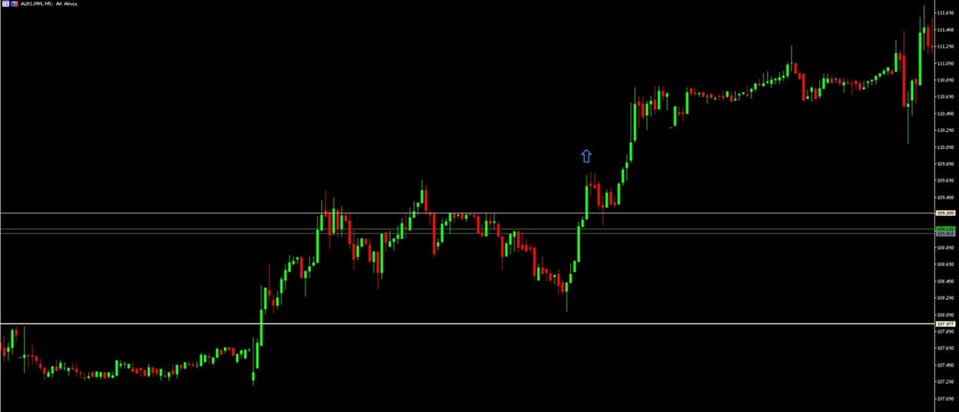
ALRS, 5 min
A breakout occurs on a strong impulse due to stop orders being triggered and positions being locked in. In the case of ALRS, the pattern worked when the price landed on a level, now considered support, and then bounced back up. This is a popular breakout pattern because during a retest, you can enter a trade with almost no risk, with a small stop-loss behind the nearest local low. Subsequently, other participants begin to join in, ensuring a steady move in the direction of the breakout. It's important to wait for the bar or candlestick to fully close above or below the level. Orders to open a trade are placed as close to the level as possible, allowing for a minimally short stop. Breakout of a horizontal level: A horizontal level can be formed by a line connecting highs or lows within a certain time frame. This could be a psychological level at a round number, such as 100 or 50. It could also be a price near which a trend reversal has occurred before—quotes reached a high or low, reversed, and the trend changed direction. On the daily chart of Alrosa shares (ALRS), the price is consolidated around 78,170 rubles. Previously, quotes were developed near this area.
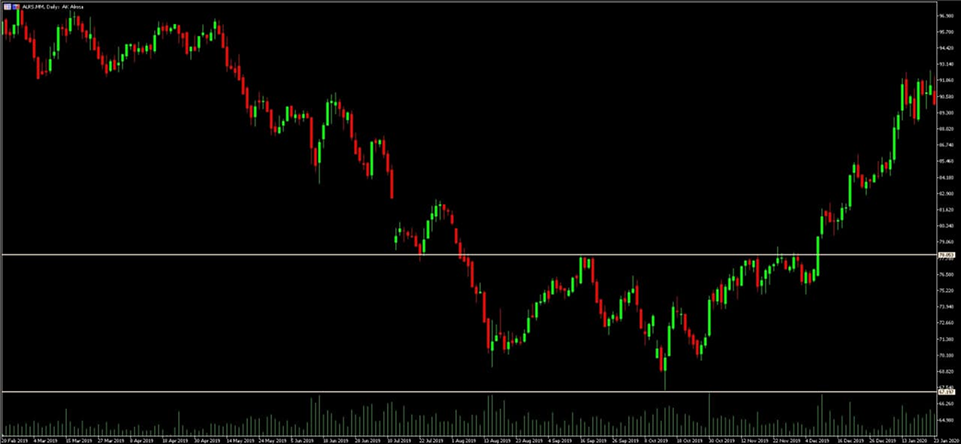
Aкции ALRS, D
The 30-minute chart shows that volumes increase as this zone is approached. After breaking through, the price moves upward.
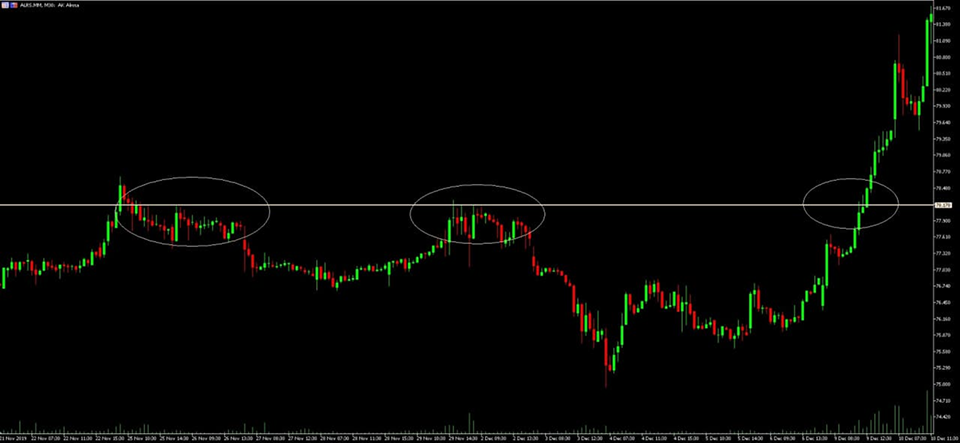
ALRS, З0 min
A true breakout is accompanied by above-average volumes and, as a rule, strong momentum, as bearish stops are triggered beyond the resistance line and new bulls join the movement. Similarly, bullish stops are triggered beyond the support line, and new sellers enter the market, pushing prices down. On the daily chart of Seversk, the price is consolidating around 1012.00 rubles in an upward trend. This is the upper boundary of the ascending triangle—a resistance line. Patterns such as triangles, flags, and pennants can often be identified in consolidation zones. Such formations are typically trend continuation patterns and are widely used by traders because they are logically clear. Exiting the consolidation zone and closing the bar or candle beyond the outer boundary is a signal.
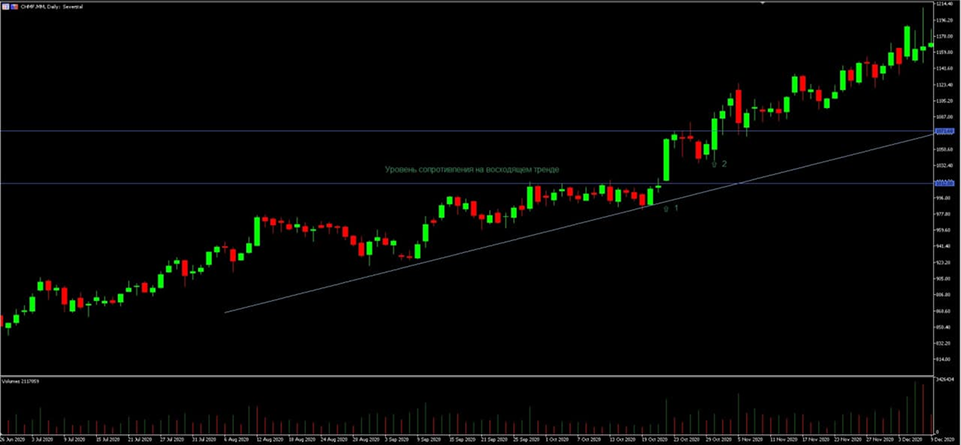
CHMF daily chart
On the 4-hour chart, the price reverses three times at exactly 1012.00, likely indicating a cluster of limit orders. False breakouts occur several times, but the price does not move beyond the lower boundary of the triangle, indicating sellers' weakness.
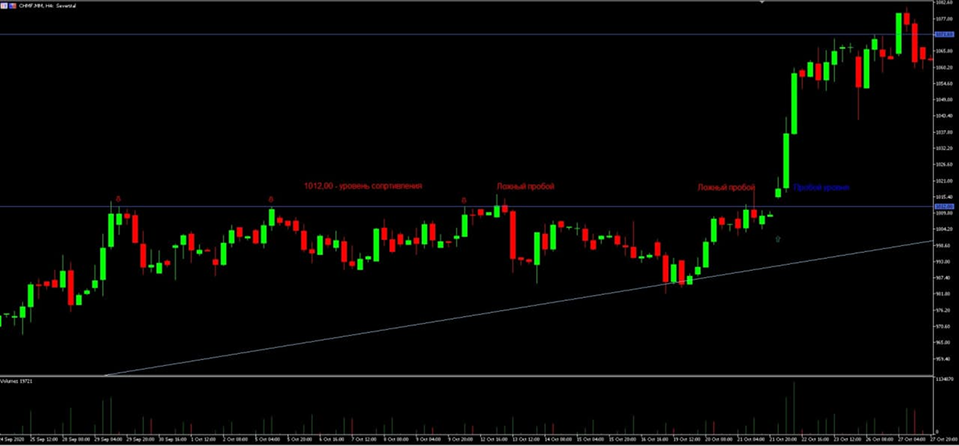
CHMF, H4
The price breaks this level, accompanied by increased volume, and then the price sharply moves higher. The breakout, which will initiate a directional trend movement, occurs with strong momentum. The market needs sufficient strength to overcome a price barrier that was previously stable and insurmountable. A breakout always has a long-term continuation. For GM shares, the price area around $56.90 is a strong resistance level—it's an all-time high. For three months, the price approached this mark and then reversed downwards.
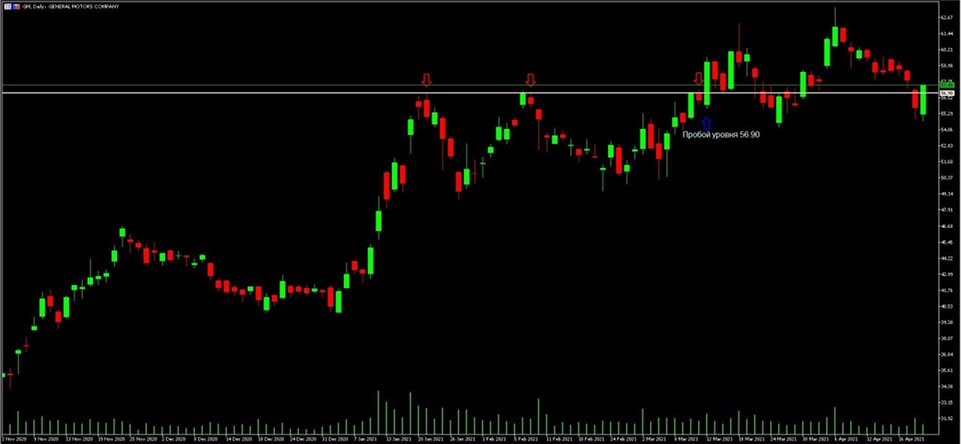
GM stock daily chart
The third approach did not cause a strong pullback, as in the previous story.
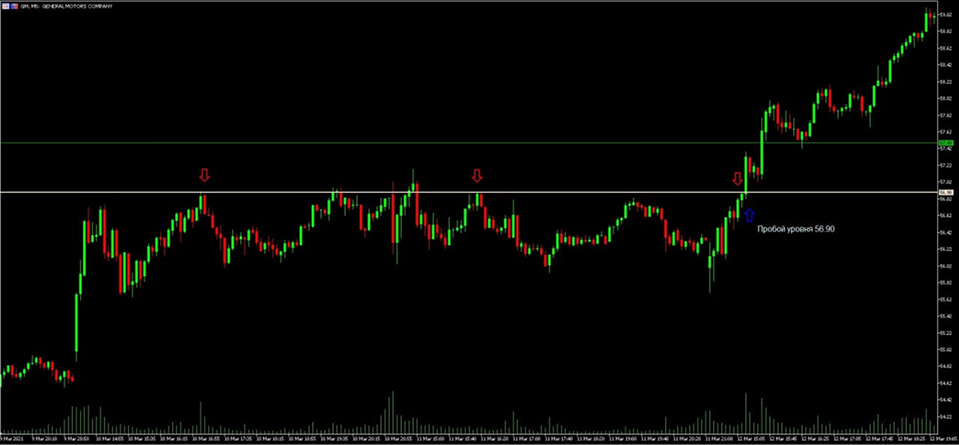
GM's five-minute timeframe
On the third attempt, the level was broken. Quotes reached $59.62. This situation did not develop long-term, and the price returned to the level again, making another attempt to break higher. BREAKOUT STRATEGIES IN THE FOREX MARKET Breakout of a trend line Forex trading based on levels is of interest even to beginners. Forex traders use trendline breakouts as a reversal signal to initiate a trade in the opposite direction. In a bull market, a trendline is drawn along rising troughs, while in a bear market, it is drawn along falling peaks. A breakout and price consolidation below the trendline may signal a trend reversal.
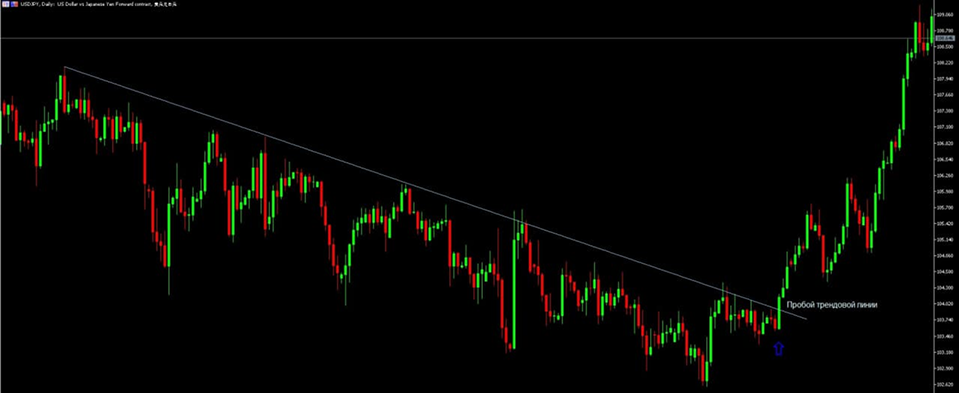
Trendline Breakout in Bearish Market, Bullish Signal, USDJPY, D
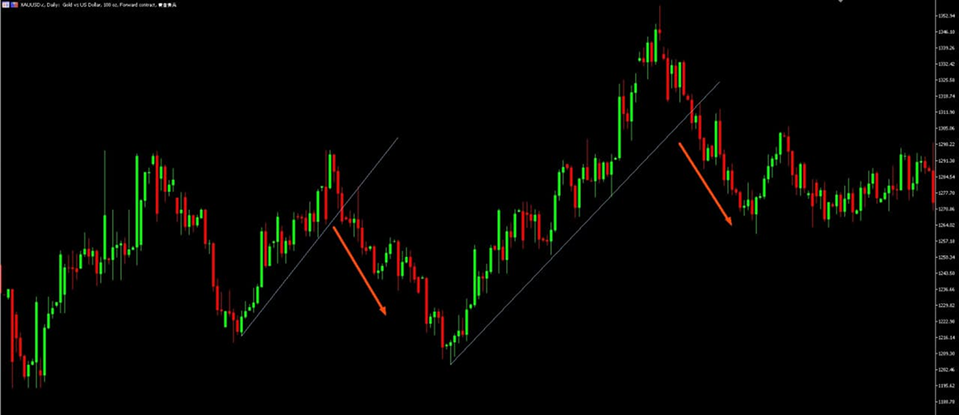
Trendline breakout in a bullish market, bearish signal, XAUUSD
Forex traders consider moving average crossovers as a breakout option. Moving averages indicate trend direction, and a candle crossing and closing beyond the line signals a possible reversal and trend change. In the short term, EMAs of different timeframes may be used, for example, EMA 5 and EMA 13. The intersection of moving averages and the price crossing and consolidating above or below the lines provides an entry signal. The strategy is used on major currency pairs on a 5-minute timeframe.
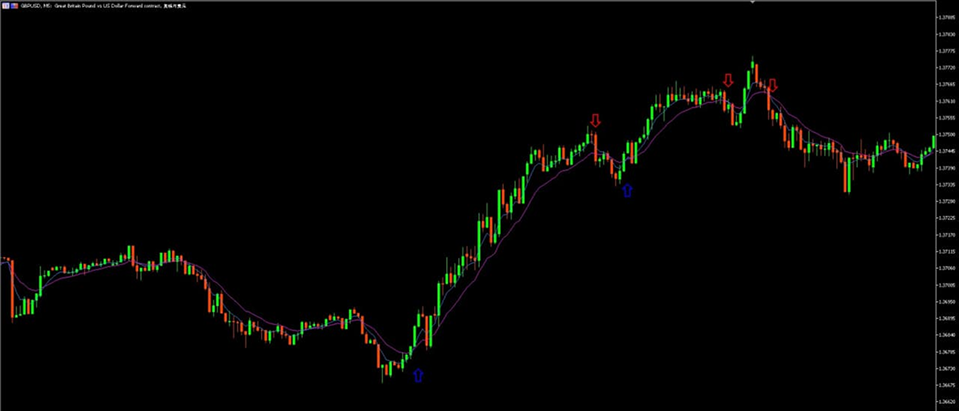
GBPUSD, 5 min
A wide variety of sliding combinations are possible for different time intervals. A similar idea is contained in the Alligator indicator by Bill Williams. The Alligator is a combination of three smoothed moving averages: SMMA 13, SMMA 8, and SMMA 5. This strategy allows for trades with varying degrees of risk—conservative, moderate, and aggressive—and allows for entry into the market at the very beginning of a trend.
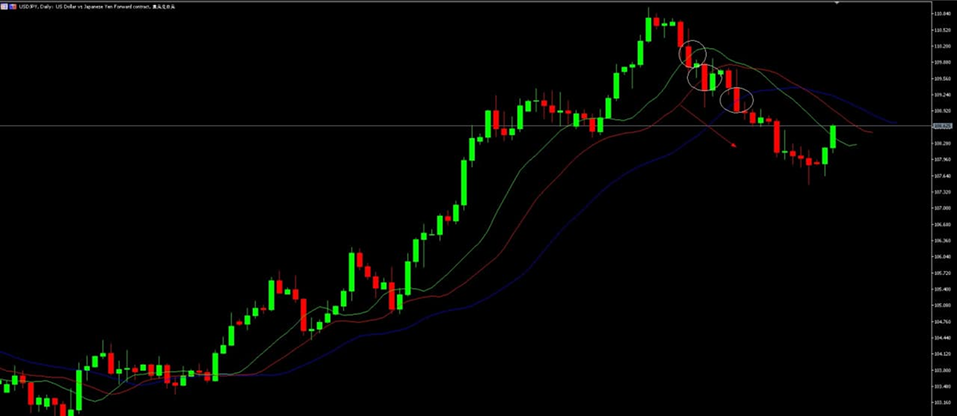
Alligator on the chart USDJPY, D and three entry signals
In the classic version, this indicator is supplemented with a fractal. Then, trades can be opened using pending stop orders, which are placed 1 pip above (below) the fractal; a sell stop is placed 1 pip below (above) the last fractal in the opposite direction. Channel Boundary Breakout: Market price doesn't move in a straight line, but rather fluctuates within a certain range. Its boundaries represent support and resistance lines that form the channel. The price bounces off one boundary and moves toward the opposite one. Channel strategies involve trading either from the boundaries upon rebound or "on breakout." Most of the time, the price moves inside the channel - the strategy of trading from levels is relevant here. Breaking the border and closing the candle behind it is the strongest signal to continue the movement.
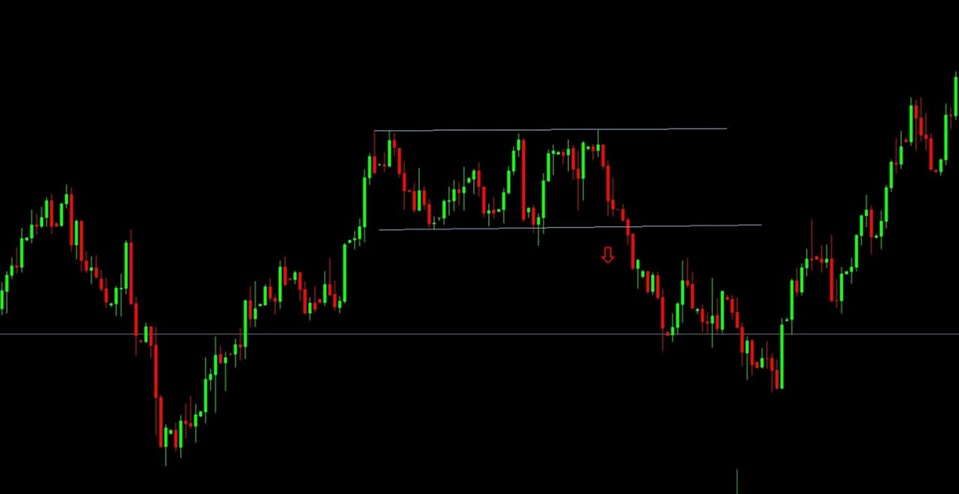
Breakout of the lower boundary of the horizontal range, USDCAD
Many traders use the Bollinger Bands indicator; it has remained relevant and in demand for decades. The developers created a strategy for trading both within the channel and during breakouts. The indicator is based on the fact that more than 90% of the time, the price is within the channel, moving from one boundary to the other. The exit and closing of the candle beyond the external boundaries is a strong signal for opening a trade in the direction of the breakout.
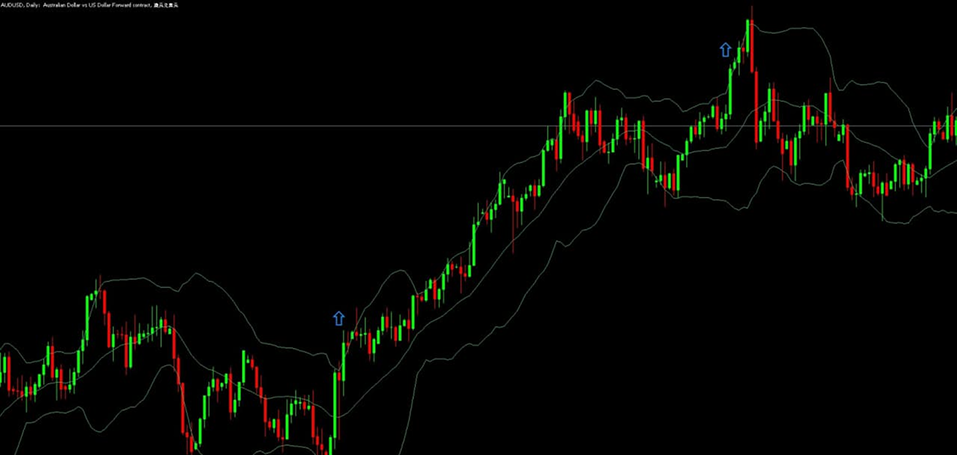
Bollinger Bands Upper Border Breakout, AUDUSD
A popular Forex breakout strategy is the "Turtle Strategy" or "Turtle Soup." This long-term strategy relies on breakouts of 20-day or 55-day highs and lows. A breakout of even one pip is a signal to enter the market. The Donchian Channel is used as an indicator, with time interval settings of 10 days, 20 days, and 55 days. The channel boundaries indicate the highs and lows of the corresponding time interval. The trade is closed strictly upon exiting the extreme of the previous time interval, allowing for the capture of the entire trend movement at its maximum.
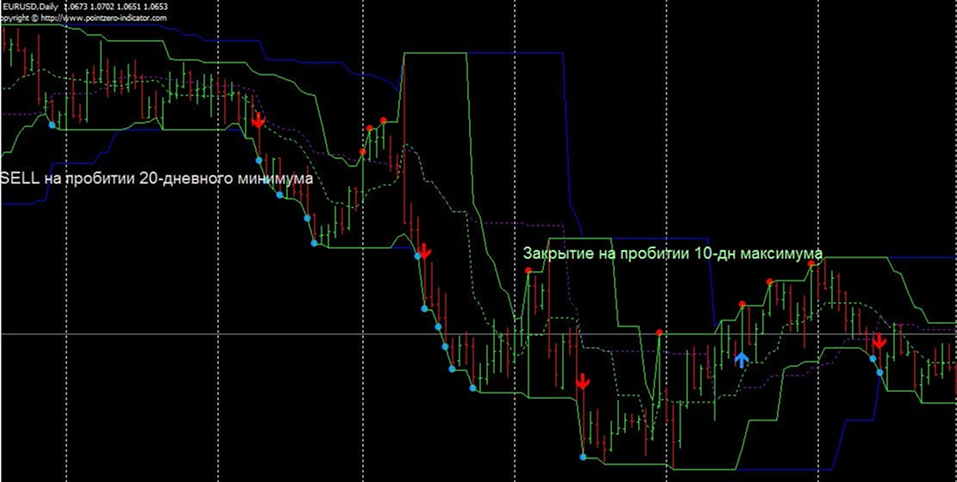
Strategy for a 20-day period
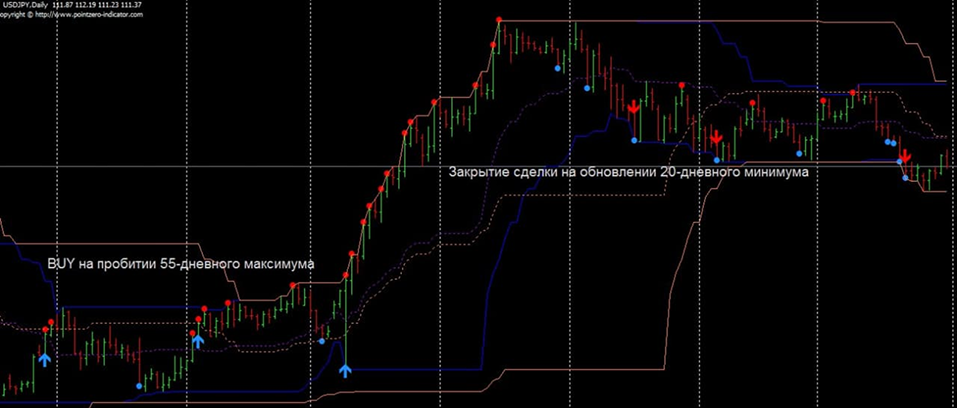
Strategy for the 55-day period
Conclusions
Breakout strategies allow you to enter the market at the very beginning of a trend movement. Breaking out of a strong level allows you to open trades with minimal risk, which is one of the most important tasks of a successful trader. Complex false breakouts are common, but only a few traders benefit from them. The downside is the possibility of failure when a false breakout occurs, but this is precisely where a tight stop-loss comes in handy. Psychologically, not all traders can trade a breakout, as they have to enter the trade either at the high or the low.