TRADE STRATEGIES IN KAHALA
Prices spend most of their time moving around some average value, deviating sometimes upward, sometimes downward, and then returning to the average value, striving for balance, but the force of inertia pushes them further until the energy is exhausted. This movement resembles a pendulum.
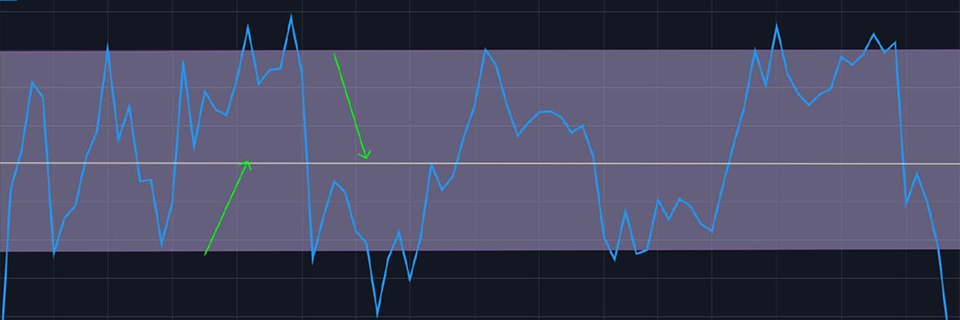
The maximum deviations form a price corridor—a range. Upon reaching the maximum values of this range, prices reverse and move toward the opposite boundary—the minimum values. Thus, the channel boundaries represent support and resistance lines. Statistics show that prices move within a channel most of the time, approximately 90% of the time, giving traders a high probability of finding a buying or selling opportunity. A price move beyond the channel boundary signals a move in the direction of the breakout.
Building a price channel
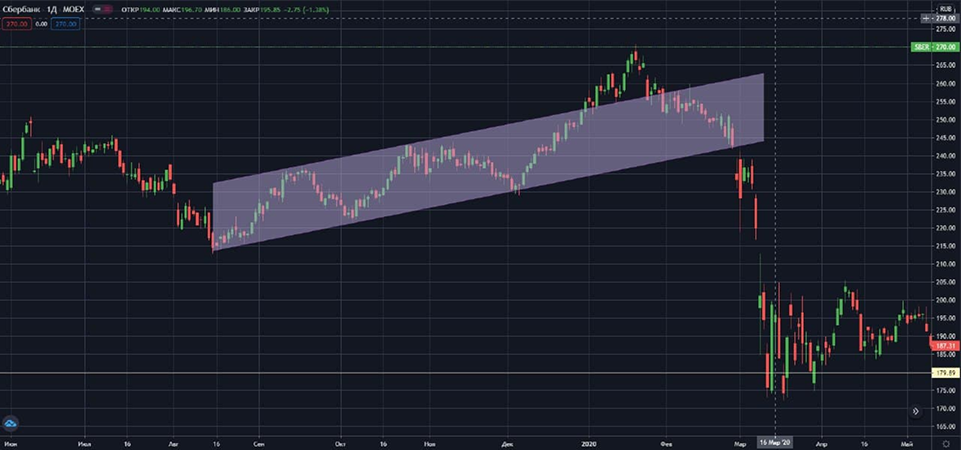
You can draw a channel on a chart manually or use technical indicators. Drawing lines on a chart involves connecting peaks and troughs with a straight line or drawing a trend line and an opposite boundary parallel to it. Depending on the trend, channels can be inclined or horizontal. Ranges plotted on daily and weekly charts are useful for analyzing the underlying long-term trend. The slope of this range shows the direction of the global trend.
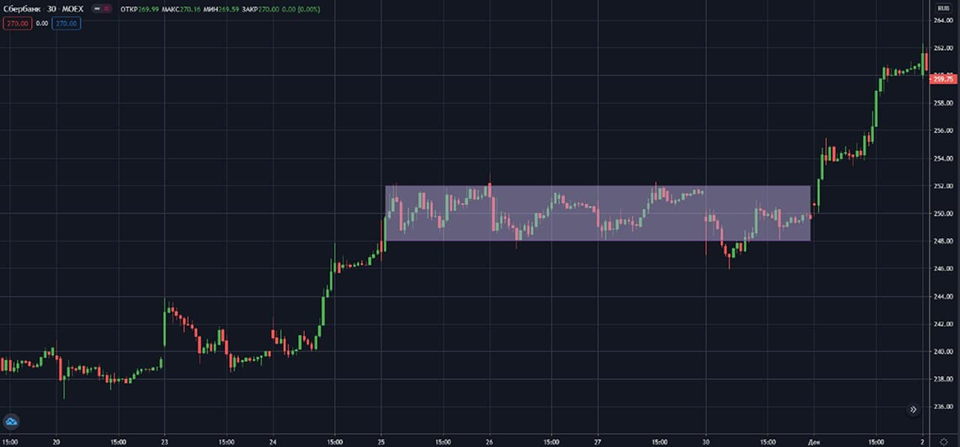
Horizontal channel on the chart of Sberbank shares, Z0min
Channels can be constructed using indicators such as the Keltner Channel, Donchian Channel, Bollinger Bands, and others.
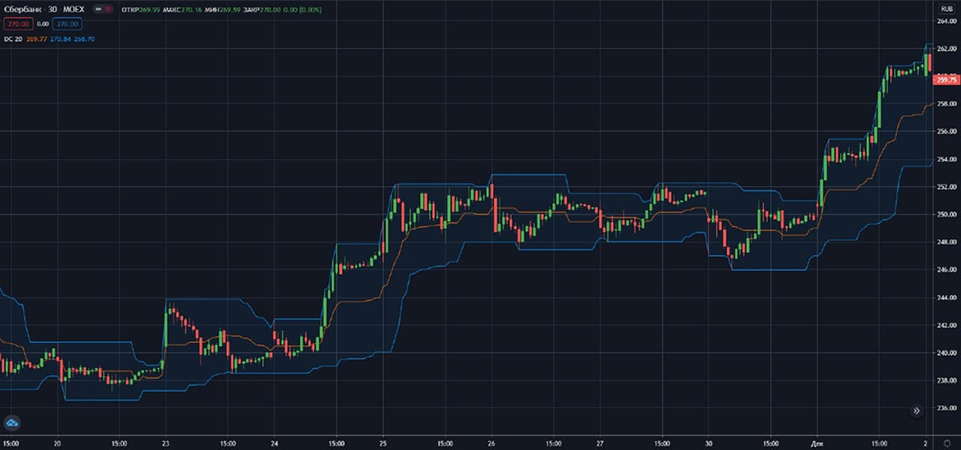
Donchian Channel, SBER, 30 min
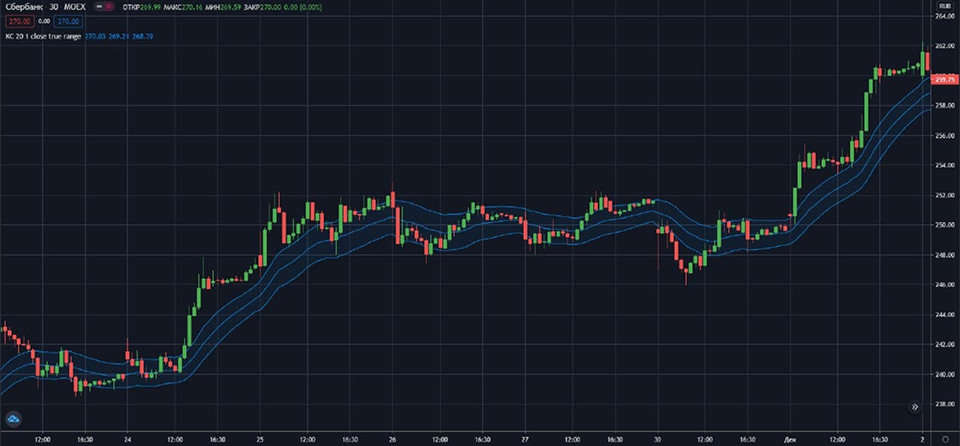
Keltner Channel, SBER, 30 min
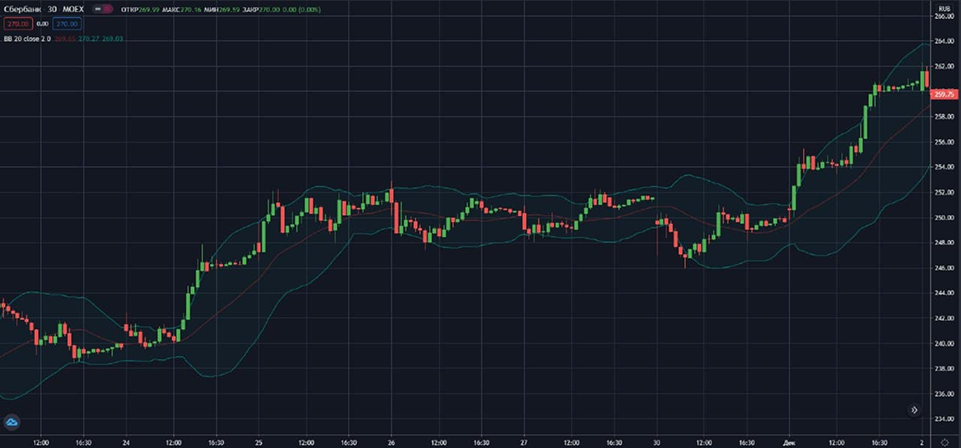
Bollinger Bands, SBER, 30 min
Channel trading
The channel boundaries show where bullish strength weakens, where resistance levels are found, or where bearish strength is found and where support areas are being crossed. This allows traders to buy when the asset is cheap and sell when it is expensive. The price range within the channel defines the boundary between normal and abnormal price behavior. Prices tend to remain within a range most of the time, and only a market imbalance caused by external factors can push them beyond these limits. The asset's price is overvalued above the upper limit of the range and undervalued below its lower limit. In a sideways horizontal channel, traders can trade within the range in any direction - buy at the lower border, sell at the upper border.
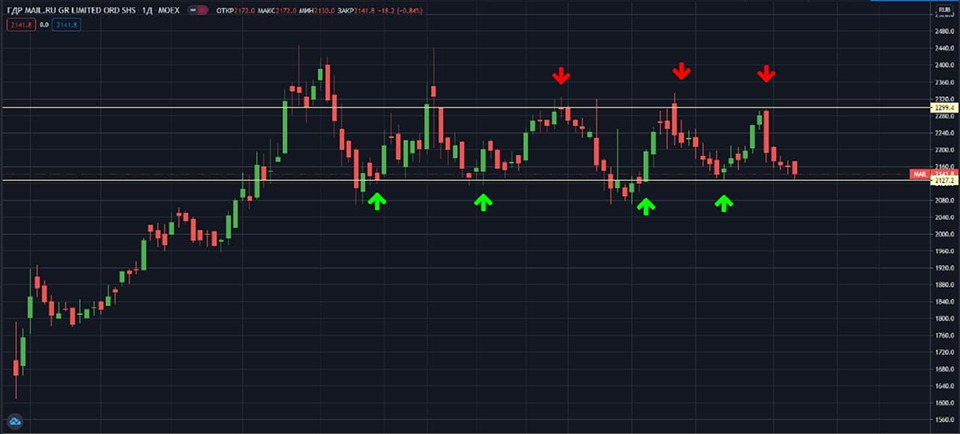
Areas of opening deals for Mail, D shares
When the channel is directed upward, it is advisable to play on the rise, open long positions at the lower border and close the deal near the upper one.
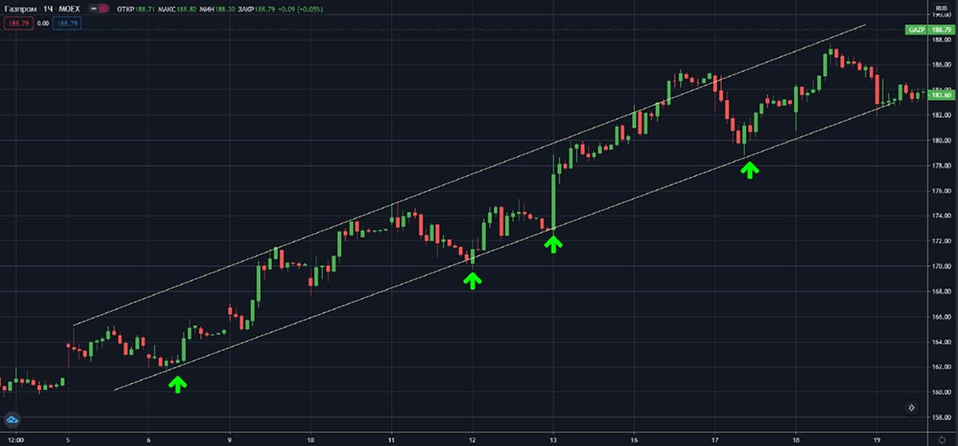
Gazprom shares, areas for purchases on the ascending channel
During a bearish trend, when the channel is directed downwards, it is advisable to play bearish - opening short sales at the top and exiting the position at the bottom of the range.
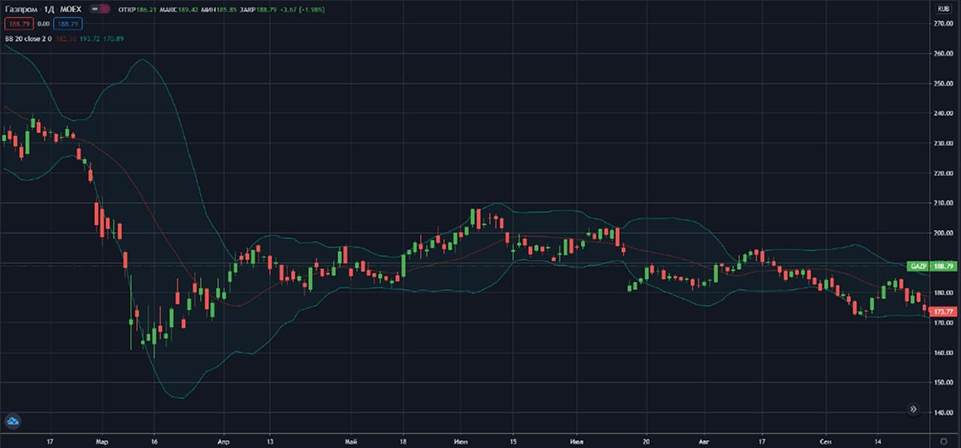
Bollinger Bands indicator
The Bollinger Bands indicator is unique in this regard. The band width changes depending on changes in market volatility. Increased volatility is accompanied by a divergence of the channel boundaries, and their direction indicates the direction of the trend.
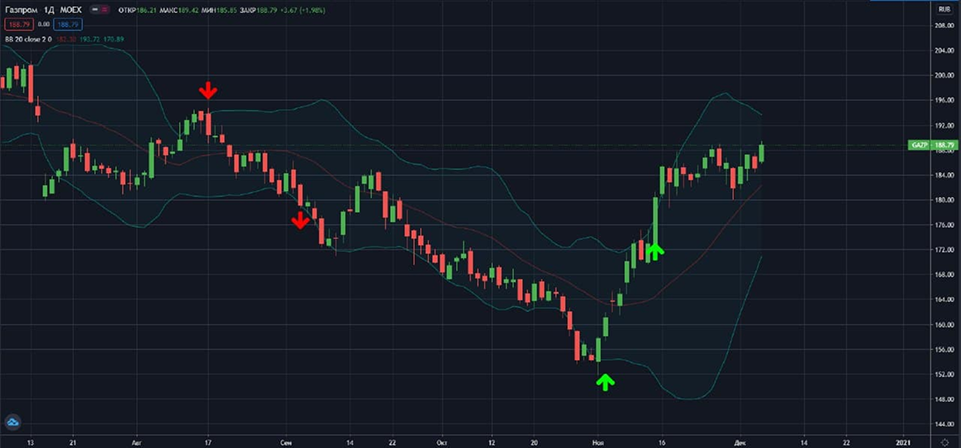
Bollinger Bands, GAZP, D indicator signals
Bollinger Bands, GAZP, D indicator signals
Narrowing Bollinger Bands
The width of the indicator's bands helps determine the moment of transition from a calm to an active market. When prices break the upper outer boundary of the Bollinger Bands after a flat, the bands begin to widen, and the middle line points upward, this provides a buy signal.
Bollinger Bands, buy
When, after a narrow range move, prices break below the lower outer boundary, the bands widen, and the middle line points downward, this gives a sell signal.
Bollinger Bands, sell, buy
Rebound and breakout strategies
Traders use channels for a variety of strategies. Professionals trade within a range. Their main argument is that prices strive for balance and equilibrium, and therefore try to stay near average values, not deviating significantly from them, thus moving within the boundaries. More aggressive traders tend to buy or sell on breakouts. Breakouts can produce larger profits when a new strong trend move develops and the trader enters a position at the bottom of the incipient move. Most of the breakdowns turn out to be false. Large players take over the positions of those traders who set their stop orders immediately beyond the level, and the price quickly returns back. However, if the price breaks the upper channel boundary and consolidates above, this may indicate bullish strength, and vice versa. A strong impulse to break the upper boundary of the range on large volumes indicates strong bullish sentiment in the market. A return to the MA after an upward breakout provides an excellent buying opportunity. A break of the lower channel boundary indicates bearish strength. When the price returns to the MA, an opportunity to open a sell trade arises. Traders use the Keltner and Donchian Channels to identify breakouts. A breakout beyond the channel's boundaries indicates that the market intends to move in the direction of the breakout.
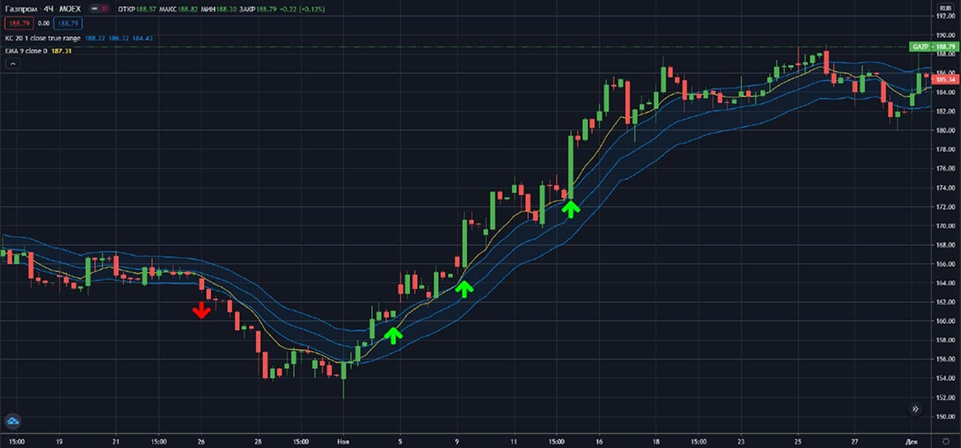
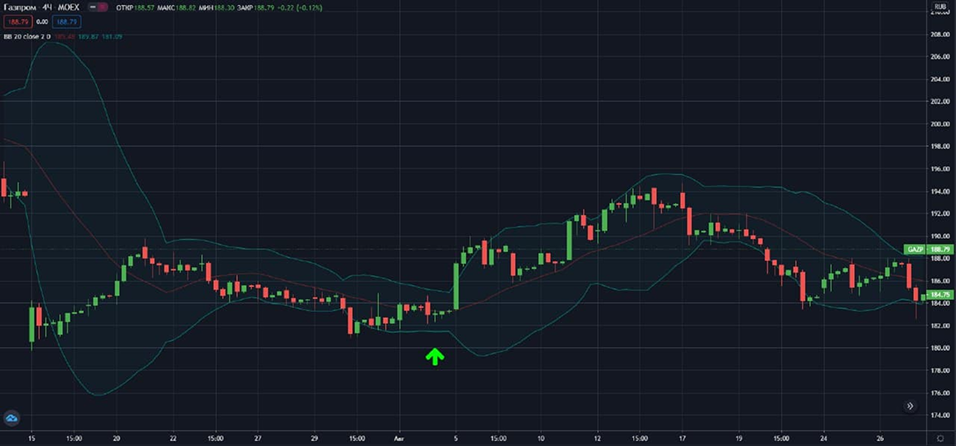
Keltner Channel signals, GAZP, H4
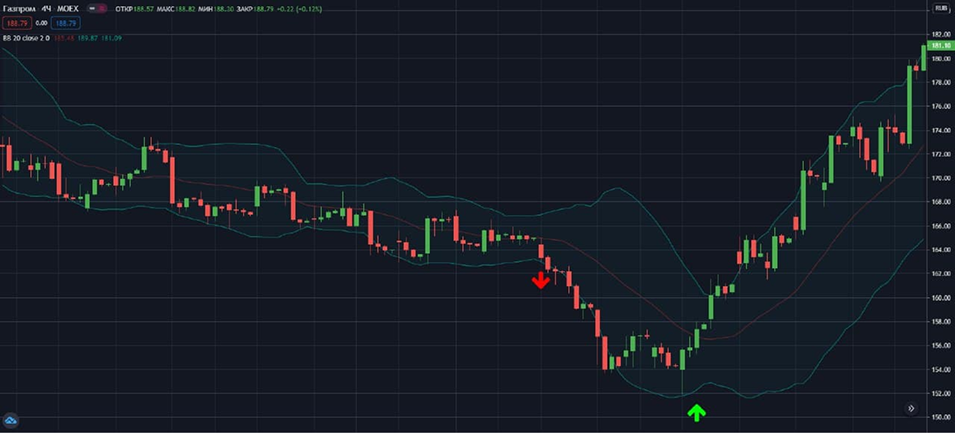
The breakout of the Donchian Channel is the basis of the famous “turtle strategy”.
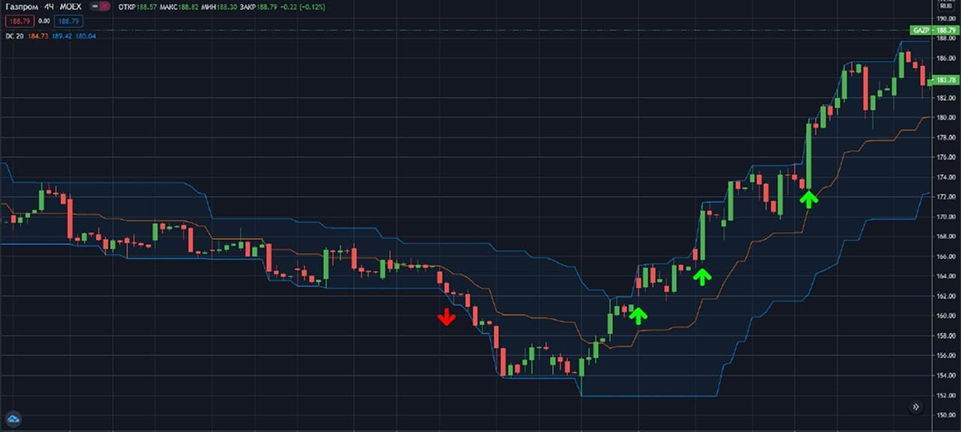
Donchian Channel signals, GAZP, H4
“Go long when prices rise from the lower end of the range on both the daily and weekly charts. Go short when prices fall from the upper end of the range on both the daily and weekly charts,“ the professionals advise.