TRADE IN THE REPORTING SEASON
Earnings season is traditionally a favorite time of year for active traders. It's a time when potential profit opportunities increase exponentially. Each quarter culminates with the release of corporate earnings reports. This is a period of heightened market volatility, and traders try to take advantage of it. Like surfers riding a wave, traders try to ride the market's reaction to the release. Earnings season is a crucial period for both intraday, medium-term, and long-term traders. Short-term traders trade stocks on the day of the earnings release and for several days afterward, capitalizing on the momentum and emotional market reaction. Long-term investors analyze a range of financial and economic indicators over time and conduct comparative analysis. This analysis considers not only the performance of a specific company but also that of other industry and economic sector players; it also assesses the overall state and prospects of the industry and the competitive environment. After research, a decision is made about including securities in an investment portfolio. Earnings season provides good trading opportunities. Statistically, traders experience their best results during these months.
What is earnings season?
Corporations report their quarterly results in January-February, April-May, July-August, and October-November. These reports include the Statement of Financial Performance, Balance Sheet, Statement of Cash Flows, Statement of Changes in Equity, Explanatory Notes, and Management Commentary. The key financial metrics that investors focus on are revenue, net profit, earnings per share (EPS), free cash flow, profitability, liquidity, and dividends per share. However, these numbers alone are uninformative. Before a report is released, experts provide their forecasts for future performance. The agreement or divergence between actual results and forecasts most often determines price movement. Even if a company reports revenue or profit growth, but the figures fall below expectations, the stock will likely begin to decline. A company's forecast for the next reporting period can significantly impact investor sentiment. An improved forecast supports positive sentiment, while a lowered forecast or no forecast at all can send a negative signal to investors and trigger selling. Report indicators are analyzed dynamically—relative to the previous reporting period or to similar periods in previous years. Absolute figures tell little; how they change over time is far more important. Young companies may also incur losses because, until they have established a market niche, their revenues are not very high, while their expenses, on the contrary, are outweighed by significant capital investments, loan obligations, etc. In this case, the dynamics are of interest. If a company is increasing its revenue quarter after quarter while its losses are shrinking, it is potentially interesting. A case in point is the American technology company Snap Inc. The company went public on the New York Stock Exchange in March 2017. Its shares opened at $17. At the end of September 2021, the stock hit a high of $83.34.
The weekly chart shows how strongly the paper reacts to the release of reports.
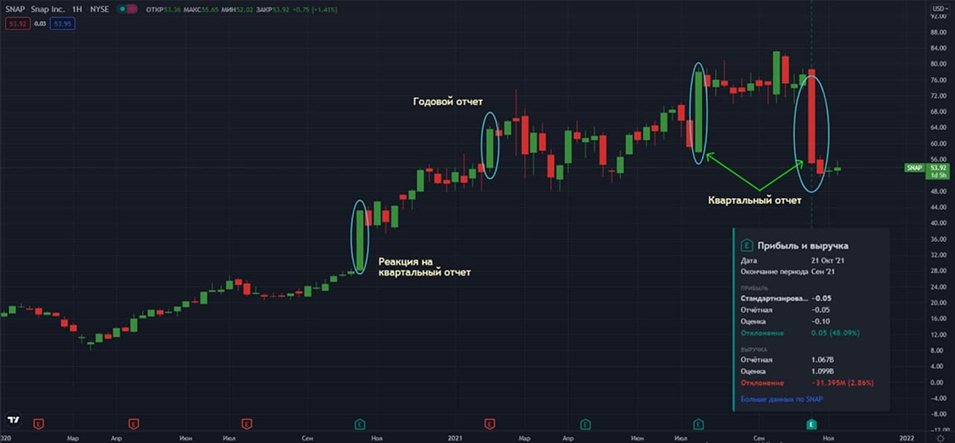
SNAP, W Snap Inc. was able to significantly increase revenue and reduce losses during this time.
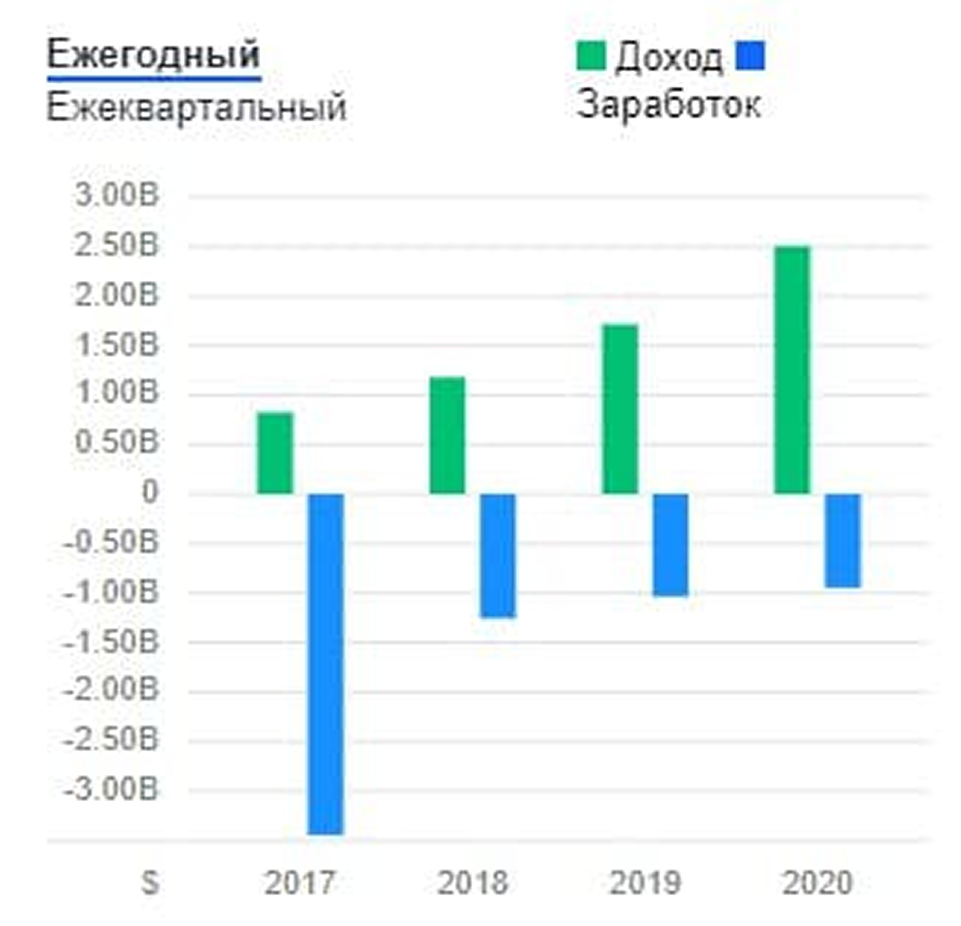
Snap Inc. Revenue and Profit: Tesla reported losses in 2019, but that didn't stop it from becoming one of the most valuable companies in the world in 2021.
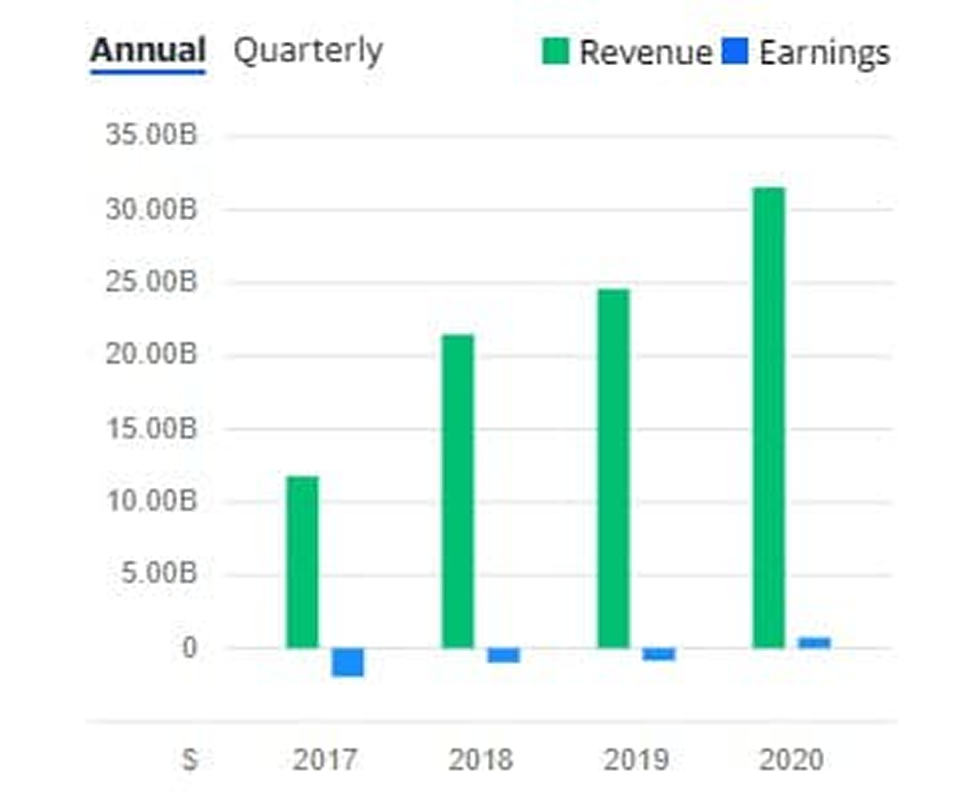
Revenue and profit of Tsla Inc
So, absolute values aren't as important here as the dynamics and the entire complex of factors. Long-term investors conduct a more comprehensive comparative analysis, using financial ratios—multipliers. One of the most common and widely used ratios is the P/E ratio—a financial indicator expressed as the ratio of a share's market value (P) to its earnings per share (EPS) or the ratio of its market capitalization to its earnings. P/E = P/EPS. This ratio is widely used for comparative analysis of companies within the same industry. Below-average values indicate that the company is undervalued, while above-average values indicate that it is overvalued. Other important multiples are: P/S (Price to Sales) — the ratio of the company's market value to sales volume (revenue); P/BV (Price to Book Value) — the ratio of the company's market value to its book value. EV/EBITDA (Enterprise Value to EBITDA) reflects the ratio of a company's fair value to its earnings before taxes, interest, and depreciation. This ratio is used to compare companies across industries and countries, as it is not affected by taxation factors. EV/CFO (Enterprise Value to Cash Flow Operations) - the ratio of the company's value to its operating cash flow. D/EBITDA (Debt to EBITDA) - used to assess the company's debt. ROE (Return on Equity) - return on capital.
What opportunities are opening up during reporting season?
US earnings reports are the busiest time in the market for day traders. Stocks that release earnings are most volatile on the day of the release and for several days following. The first step is to study the calendar. Preparing for the workday is similar to the "trading stocks on the news" strategy. (All information about strategies is presented in the professional trader's blog. So, the work begins with studying the list of companies that are reporting today and reported the day before. Data on the date and time of the report's release, forecast indicators are posted by many resources, such as Finviz.com, FinanceYahoo.com, Briefing.com. The list can be found on the Briefing.com website. tab “Calendar” - “Reports”.
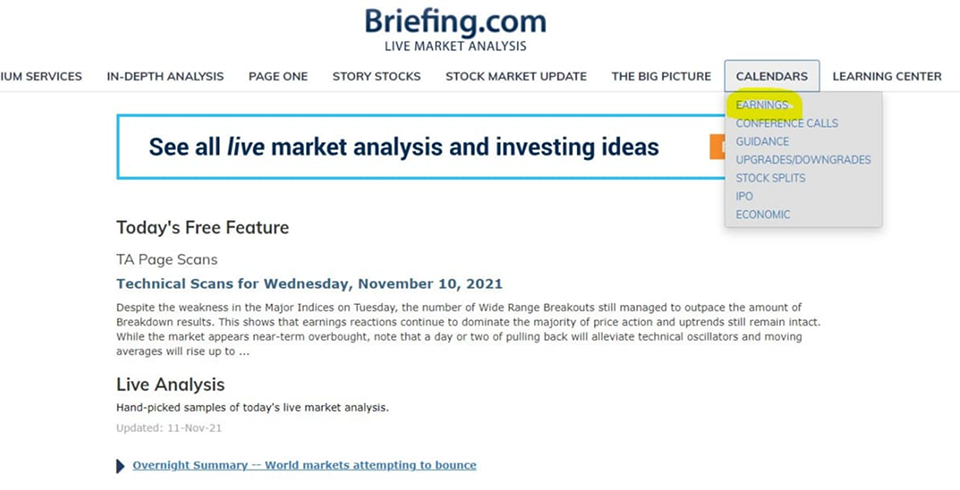
The list has two parts. One part is for pre-market releases, and the other is for post-market releases..
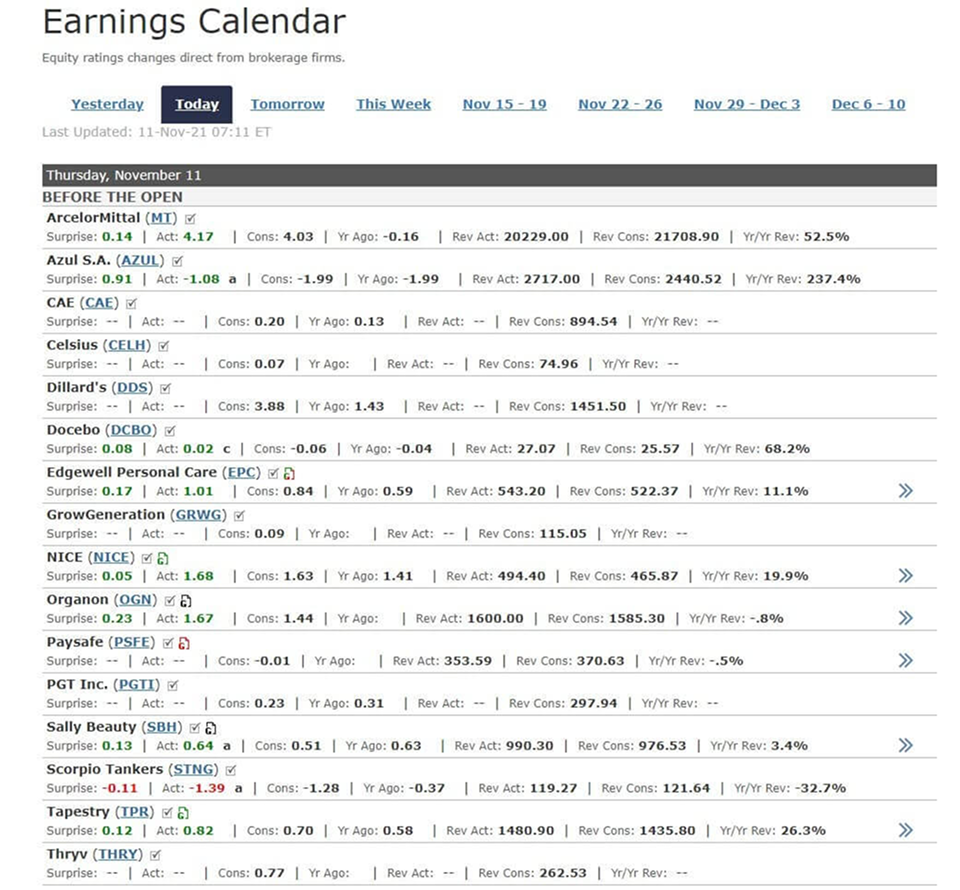
Reports before market opening
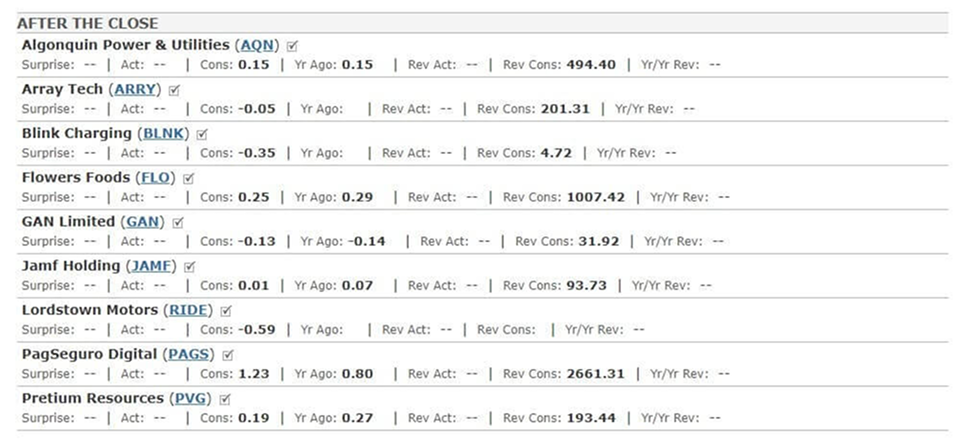
Reports after the call
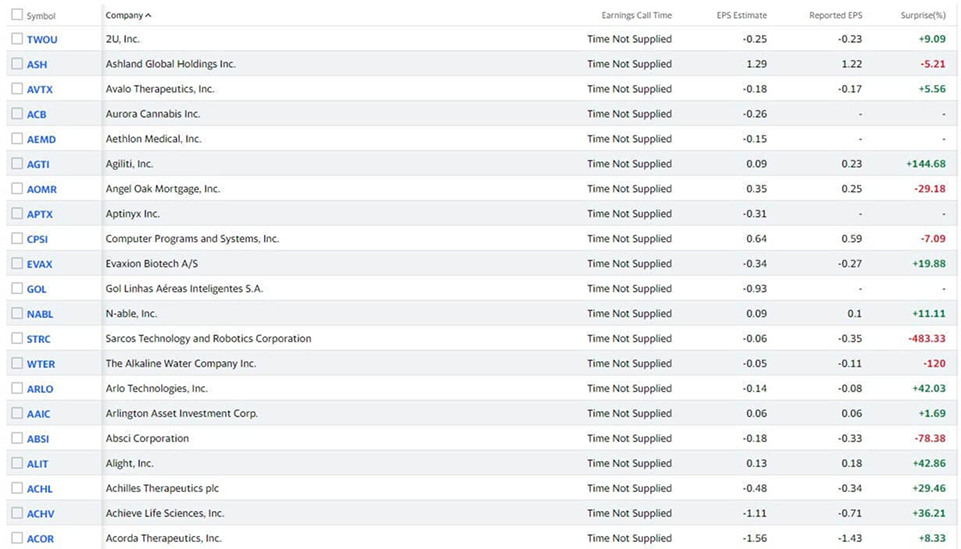
The Yahoo Finance calendar opens from the Market - Calendars - Earnings tab.
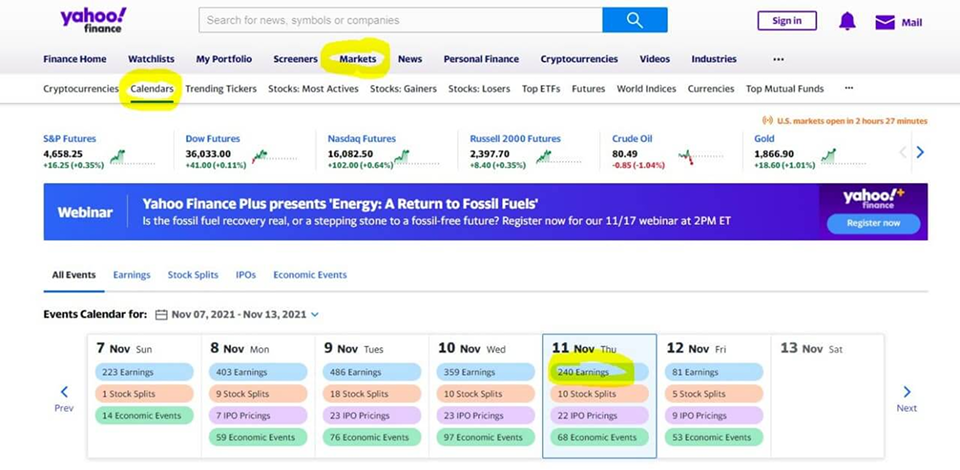
Yahoo Reports Menu and Calendar
Peculiarities of trading during the reporting period
Traders monitor the stock not only on the day of the earnings report but also in the days following it. Often, by the second day, emotions have calmed somewhat, and the stock looks more technical and easier to trade. If a company reports before the market opens, traders watch the stock's movement in the pre-market, identify key levels, study the technical picture, and develop an action plan. You can learn how to effectively use patterns in trading on this page. If the report is released after the market closes, potential trades in such securities occur the following day. And here, whether there was a reaction during additional sessions is important. Active trading in the after- and pre-market is a signal that the stock will be of interest during the main session as well.
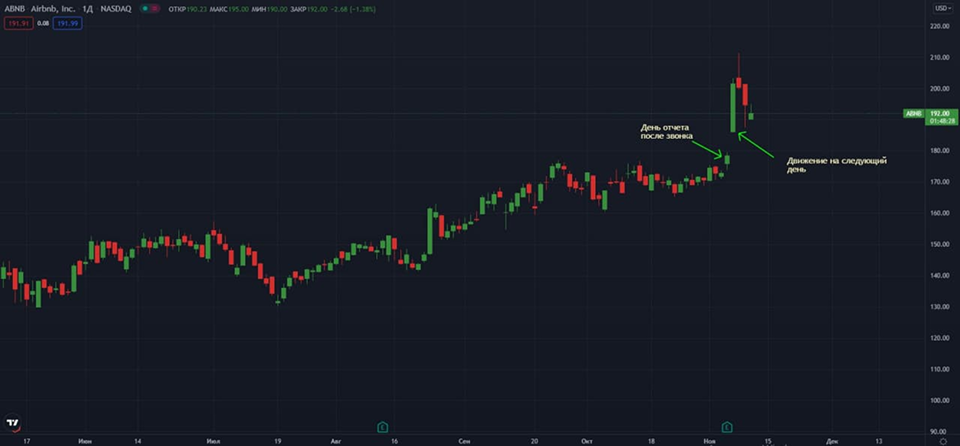
ABNB Report November 4 After the Call, (ABNB, D)
The next two trading sessions provided good trading opportunities.
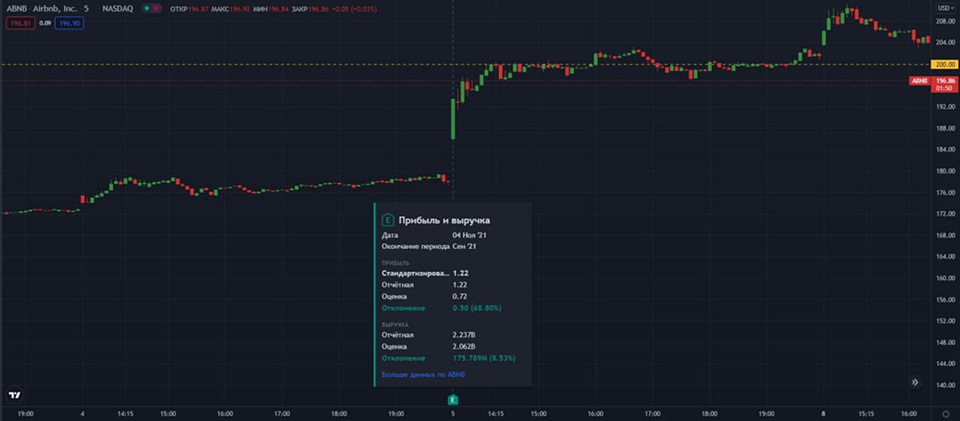
ABNB, 5 min
Follow the leader
The market situation cannot be viewed literally and unambiguously—good numbers in a report do not always guarantee price growth. The market is a complex mechanism driven by a huge number of competing factors. There are times when a good report fails to elicit the expected positive reaction due to strong overall bearish sentiment, or, conversely, a stock soars for no apparent reason. During earnings calls, following the leader can be a useful strategy. The market reaction to a large company's earnings call can be so powerful and dramatic that it triggers movement across the entire sector. Therefore, this factor can be exploited and join the "common circle." It is noteworthy that the papers that follow the leader may be more understandable and predictable.
American company reports
All public companies listed on U.S. stock exchanges are required to publish a quarterly report four times a year, with an annual report being issued at the end of the year. Filings are submitted to the U.S. Securities and Exchange Commission (SEC). Quarterly reports for U.S. companies are filed on Form 10-Q, and annual reports on Form 10-K.
Previously, the US season opened with the publication of Alcoa Corporation's earnings report. However, these days, the largest American banks—JPMorgan, Wells Fargo, Bank of America Corporation, and Citigroup—are leading the way. The reporting period typically lasts three to four weeks, but the winter season extends to almost a month and a half, as both quarterly and year-end results are released during this time. During earnings season, market volatility increases significantly. This offers the opportunity to earn more than in the off-season, but the risks also increase, and this is something to keep in mind.